AgMRI
Redesigning a crop & soil insights app for field-centered usability and enterprise-scale effectiveness
CLIENT
IntelinAir, a startup founded on using AI-analysis of aerial imagery to provide realtime field and crop insights to farmers.
IMPACT
Improvement in product usage amongst existing users, with 4x increase in DAU/MAU
3x increase in new customer adoption vs prior growing season
Contributed to $20M Series B raise
Recognized by CropLife as one of the “Best Agriculture Apps of 2023”
MVP Customer feedback:
“I like that I’m able to navigate it quick and that you cut all the other mumbo jumbo out of it. 2 clicks and I’m able to get the info I need…no other tool will give you this info this quick.”
“This design is 9/10 while previous AgMRI was 4/10”
“I rely on the alerts to highlight what I should look at (I have too many fields to monitor them all) - then I look at the images to verify if I need to go in person or wait until the next flight
TEAM/ROLE
UX+UI Lead (myself) + Product Owner, 2x Business Analysts, User Research Lead, Tech Lead, Offshore Engineering team
RESPONSIBILITIES
As UX+UI Lead, the scope of my work covered:
Workstream scoping, planning and management
Collaborating on initial user discovery, insights generation, feature backlog building and MVP prioritization
Defining user flows & wireframes for MVP features
Leading concept and usability testing with target users
Collaborating with client SMEs to refine MVP feature set and usability
UI development across iOS and iPadOS
Building a design system that retained the client’s existing visual language while making improvements in usability and performance
Design documentation (redlines, prototypes, annotated files) & support for F/E development

Context
IntelinAir’s proprietary M/L model provides information about crop health, growth progression, weed presence, soil quality and disease from aerial imagery alone. Their initial business model and product targeted individual farmers, charging them a subscription fee for local flyovers and access to a desktop app that provided the core information generated from the imagery.
Problem/Brief
IntelinAir found that their initial B2C business model was unsustainable due to low customer uptake and high customer acquisition costs. The desktop app also faced issues, with difficult navigation, confusing UI and poor overall usability being key user complaints.
The intial brief called for:
New feature set that supported IntelinAir’s pivot from a B2C (farmers with 1-2 properties) to a B2B approach (enterprise farm managers with 5+ properties from different farmers, and seed & fertilizer salespeople)
Usability and visual improvements to the app
User discovery and building the feature backlog
With the User Research Lead, we conducted hours of field visits and virtual interviews with client SMEs, current users and potential new users within the target profile to understand usage environments, use cases, needs and pain points. We then worked with the client to translate these findings into potential features, before collaborating with PO and Tech Lead to build out and prioritize the feature backlog.

Above: Compiled notes from Zoom and in-person interviews, with quotes and insights grouped by theme

Left: Consolidated user journey mapped out against the farming seasons; includes current steps, pain points and mapped to future state use cases
Below: Working with the PO to break down use cases into detailed user stories, with prioritization and sizing done together with Tech Leadership and SMEs

My role throughout this process was to bridge the gap between the different phases of design and ensure that the initial user insights continued to resonate throughout (e.g. translating insights into potential features; planning and leading client cocreation workshops; sizing UX impact of product features).
Collaborative MVP design and build
With MVP features defined, I then set about defining the user experience - using user flow diagrams, wireframes and clickable prototypes to routinely test with client SMEs and target users. I also held weekly sessions with the tech lead and offshore dev team to keep them in the loop of new developments and encourage early discussions around technical feasibility.
As high-fidelity designs progressed, I compiled a library of UI components and patterns that remains in use by the client for new UI development.
Key elements of the revamped AgMRI experience are highlighted below.
Mobile-first design, navigation and information architecture
The desktop-only build of prior AgMRI versions was a huge barrier to consistent adoption; users spend most of their time out in the fields, which meant they were unable to access the data in a seamless manner.
A ground-up mobile redesign of navigation and information hierarchy means AgMRI’s users can now access their insights in realtime while in the fields.
Usage statistics guided our decision to focus MVP on iOS. This allowed me to utilize iOS’ modal sheets are used to effectively display different levels of information, so users can quickly sort and drill down between growers, fields, and specific areas of concern.
Mitigating risk to crop yield by accelerating issue detection, triage and resolution
Speaking to AgMRI’s target users, we found the early detection, triage and resolution of issues that might threaten crop health and yield to be a top concern.
However managing hundreds of fields for multiple clients made this challenging, even with access to remote analytics found in prior versions of AgMRI.
We made proactive alerts and triage a core element of our redesign, with users receive in-app and text alerts when their fields are experiencing critical issues.
A dedicated Alerts tab shows Alerted fields are also prioritized in order of acreage at risk and suggestions of potential causes - helping users triage which fields need attention first.
Drill down into realtime and historical field data quickly and seamlessly
While users found automated insights helpful in initial issue discovery and triage, being able to view and manipulate the raw data was still a key requirement.
Intuitive field-level navigation enables users to view current issues, past events, make annotations and measurements, and toggle between different visual analysis filters.
Quickly create and log detailed scouting reports
One of the biggest pain points farmers, field managers and their employees faced was recording and managing scouting reports - often resorting to a haphazard mix of physical note taking, photos, or note apps. This made tracking down past records for fields challenging.
The dedicated Scouting tab includes a robust report creation and tagging flow, enabling AgMRI users to quickly log issues, photos and severity in a single source of truth that the entire team can access.
Additional insights and detail through the desktop web app
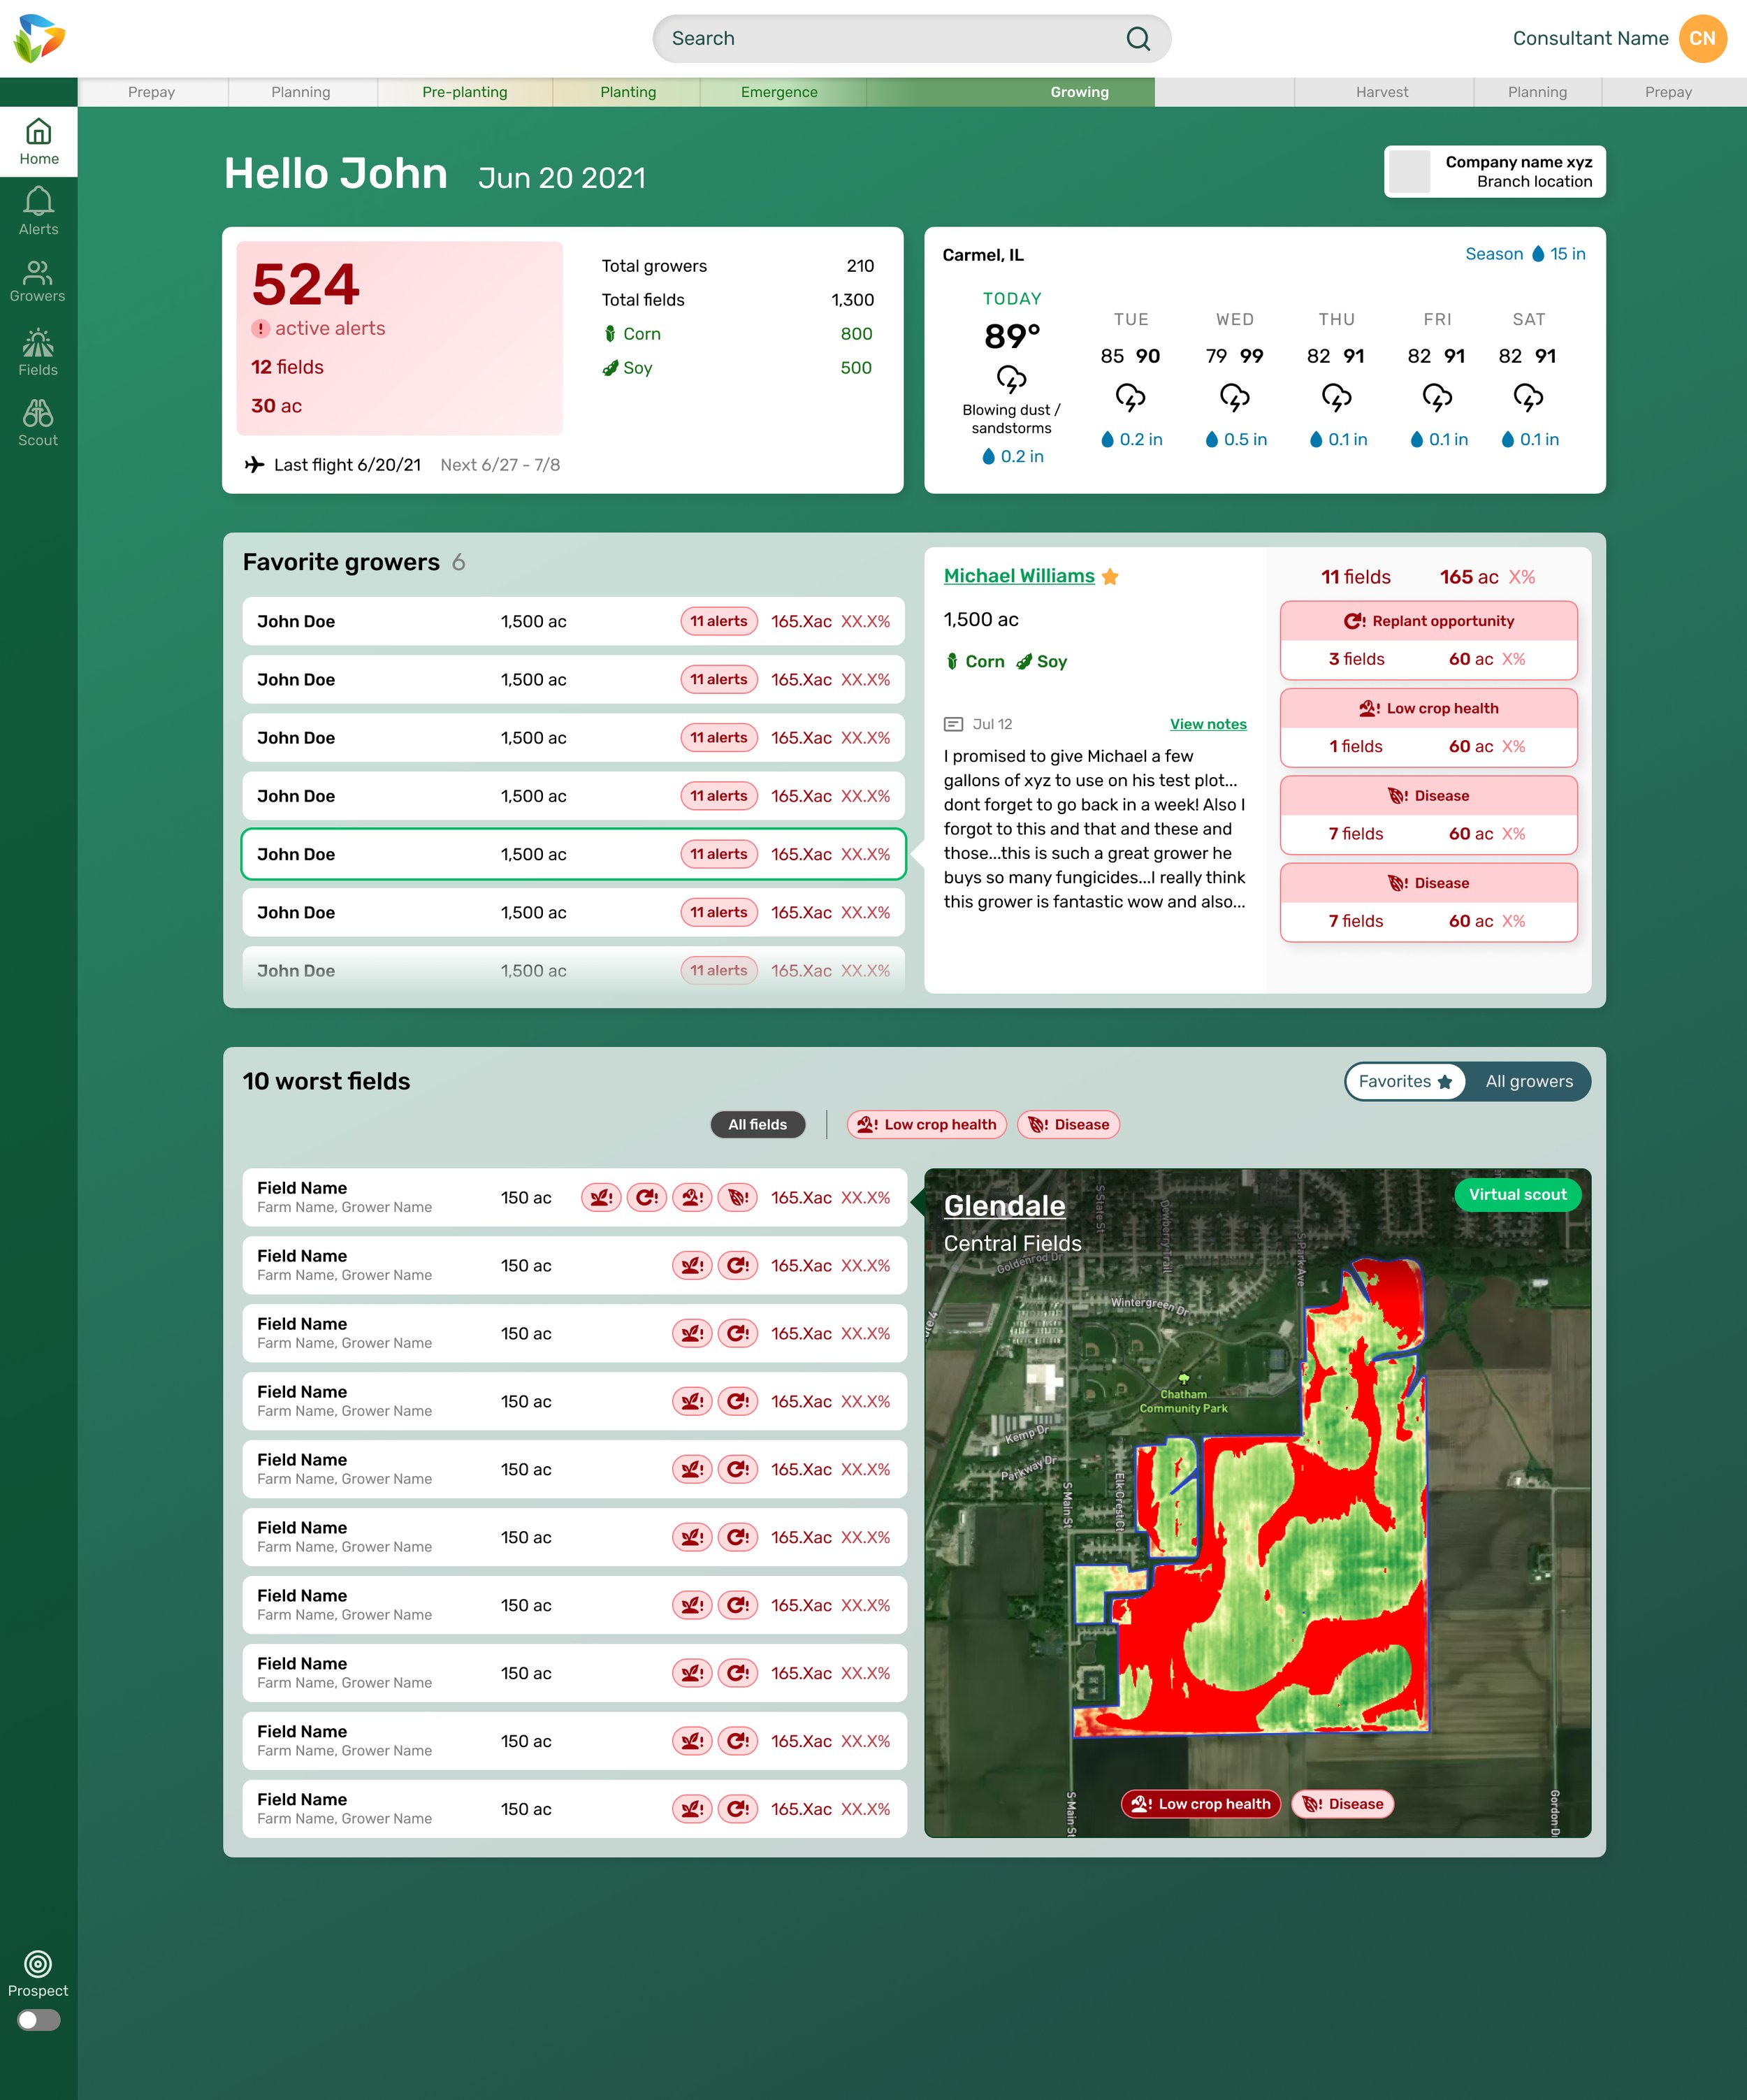
Field managers back in the office are able to maintain a birds eye view of their farm operations in the desktop app, along with additional context and insights in their landing dashboard.